

I am seeing a lot of analysts and advisors using the Kalecki profits equation with increasing frequency. And with this increasing frequency of use I am also seeing increasingly misleading assumptions built into the analysis. For instance, this article at Advisor Perspectives says profits are likely to decline because the budget deficit is declining. This same article could have been written one year ago and would have misled investors into a disastrously bearish positioning. The thing is, when analyzing the Kalecki equation we have to dive deep into the components to get the full picture. If you’re not familiar with the Kalecki equation you might want to review this post of mine and then come back.
If we look at the breakdown of components as a % of GDP we get the picture below. Now, I like to break down the corporate sector as dividends PLUS net investment because dividends have become a huge piece of the pie here in recent decades as cash flush corporations have increased dividends. This shows the breakdown between the various sectors. Remember, you have to use a 4 or more sector analysis here or you’ll get this all wrong. And I have a feeling that’s what a lot of people have been doing by looking at the government deficit and just assuming that the private sector won’t be able to generate profits without the government. That’s the wrong way to understand this. You have to look at the 3 sector analysis and THEN dive into the private sector through a 4 sector analysis that breaks down the business sector and households sector because businesses and net investment are just about always the key component in the profit picture. This is all an extension off Monetary Realism’s work on S=I+(S-I). If you didn’t understand that equation in 2012 you likely got way too bearish about the economy and the stock market which has turned out to be a very bad call.
Anyhow, when you break it down it looks like this:
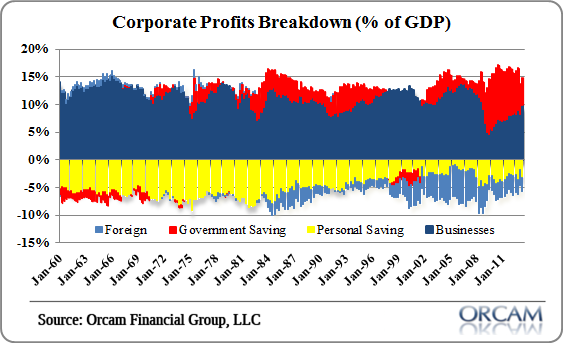
In percentage form, as of the most recent quarter, that’s:
- Government deficit: 5.1%
- Businesses: 9.8%
- Foreign: -2.5%
- Personal saving: -3.3%
What should really jump out here is how the profit story has been increasingly driven by corporate America just like it normally is. As the red bar has come down the blue bar has come up. That’s largely because tax receipts have increased as domestic investment and dividends have gone up. So the budget deficit has declined as a result.
What’s interesting to note here is that the budget deficit helped bolster profits in the 2009-2011 period during the Balance Sheet Recession when private investment collapsed. Back in 2009 the tables were flipped and the government deficit was contributing twice as much to profits as corporate America was. But that’s all reversed entirely today and now the main driver of profits is once again businesses. Since 2011 the deficit has fallen over 30%.
Now, this doesn’t mean the budget deficit’s decline is a good thing (I actually don’t think it is because I think profits would be higher if the deficit was larger), but we’ve seen the deficit decline by -30% in 2013 and yet profits are up 5% year over year and S&P 500 net income is up 5.7% as of Q3. Those who were extremely worried about the sequester in 2012 and the budget deficit decline ended up making a colossal forecasting error as revenues have continued to grow modestly and profits have continued to expand despite the substantial negative decline in the budget deficit. And that’s largely because the deficit’s decline has been offset by increases in private investment, dividends and some minor help from personal saving and the foreign sector.
On the whole we have to be careful not to look at the equation as a 3 sector model and assume that the private sector can’t become better off without the government’s consistent deficit. That’s simply not true and the last 2 years have proved this correct as the deficit has declined and the economy has continued to grow and profits have expanded. Additionally, the deficit’s decline in the last two years is largely a sign that the private sector is getting healthier and not necessarily a leading indicator of worse times to come (because it’s been due to tax receipt increases and not spending cuts). And none of this even touches on the fact that the S&P 500 EPS also includes share repurchases and other index specific factors that the Kalecki equation won’t really help you evaluate at all.
The bottom line – be careful how you analyze the Kalecki Profits equation and understand that there are a lot more moving parts here than you likely think.
I’ll revisit all of this later in the year with an update to where I think profits are headed in 2014.
Mr. Roche is the Founder and Chief Investment Officer of Discipline Funds.Discipline Funds is a low fee financial advisory firm with a focus on helping people be more disciplined with their finances.
He is also the author of Pragmatic Capitalism: What Every Investor Needs to Understand About Money and Finance, Understanding the Modern Monetary System and Understanding Modern Portfolio Construction.
Comments are closed.