Just some quick thoughts on a busy day:
1) Is the bond bubble about to burst? David Tepper was cited on Bloomberg earlier today calling for the end of the “bond bubble”. I have no idea if he’s right. Personally, I still have a hard time seeing permanently higher inflation in the coming 5 years, but I could be totally wrong. But even if I am wrong I think it’s important to remember a point I highlight in my book – a bond bear is very different from a stock market bear. Since 1928 the 10 year US Treasury note has been negative in just 14 calendar years. Those negative years averaged a -4.2% return. Stocks, on the other hand, have been negative in 24 of those calendar years and with an average decline of -13.6%. The worst calendar year decline in stocks was -43% while the worst calendar year decline in bonds was -11%. So it should be clear that a bear market in bonds is very different from a bear market in stocks. It’s important to keep that in mind when digesting Tepper’s comments.
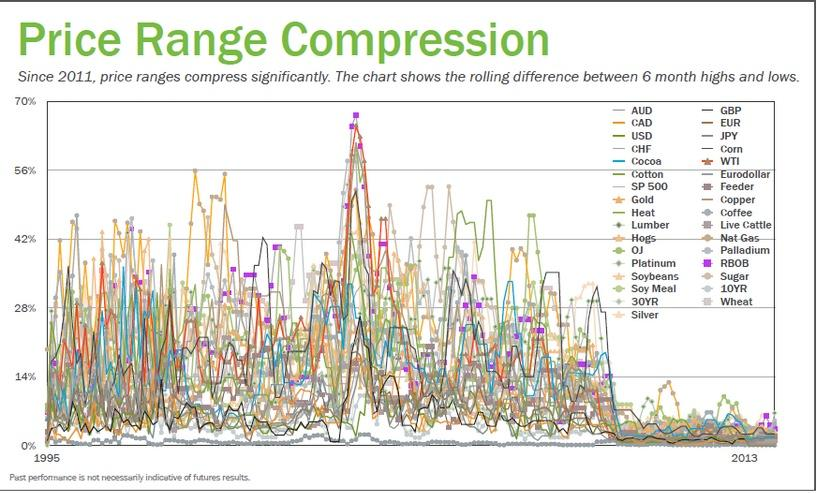
2) The scariest chart around today? The following chart was posted by Michael Melissinos on Twitter. It shows the price ranges of different asset classes between 6 month highs and lows. The post-2011 period is frightening. It’s almost as if the implementation of QE2 at this time convinced the markets that volatility was never going to be allowed again. Which seems to have worked so long as the economy has remained relatively stable. But I have a feeling this is not going to persist. The volatility will come back. It always comes back at some point. And this looks like one sign of substantial complacency with regard to how much central banks can contain asset price movements and influence aggregate economic stability.
3) Howard Marks wrote a tremendously good letter this month on risk. I won’t spoil it for you. Just go read it.
Mr. Roche is the Founder and Chief Investment Officer of Discipline Funds.Discipline Funds is a low fee financial advisory firm with a focus on helping people be more disciplined with their finances.
He is also the author of Pragmatic Capitalism: What Every Investor Needs to Understand About Money and Finance, Understanding the Modern Monetary System and Understanding Modern Portfolio Construction.


connie hawkins
there is inflation, its asset inflation. regarding consumer prices, its hard to tell just looking at the cpi, because its not a good indicator, and how its actually calculated is a mystery. the government no doubt benefits from a lower cpi.
pezhead9000
Inflation – it depends. Do you have kids in college? Healthcare issues and/or premiums? Rent? Drink coffee? Then you know all about inflation..
https://www.advisorperspectives.com/dshort/updates/CPI-Category-Overview.php
Cullen Roche
Pez, picking parts of a basket of goods is not “inflation”. Inflation is a rise in the overall price level. Saying that there’s inflation because some items have risen is like saying that stocks rose in 2008 because a handful of stocks didn’t go down. Inflation, as in the prices in the broad consumer goods basket, as it relates to our actual expenses, is low and has been low for some time.
Geoff
As discussed in one of your previous posts, for those with a moderately sized savings portfolio, one of, if not THE, largest annual expense (more than food and shelter) is the cost of investment management.
Given the recent downward pressure on MERs and other investment fees, this should help the overall inflation stats!
connie hawkins
thats part of the fallacy in the cpi as an indicator. inflation all depends on the goods one actually buys.
Cullen Roche
The CPI is weighted in terms of relative importance.
https://www.bls.gov/cpi/cpi_riar.htm
I am sorry, but the CPI is not a big conspiracy. It’s actually a soundly constructed
kj
That chart in #2 is most probably wrong. I would ask for sources…Corn went from 520ish 6 months ago to 346 now, a 33% drop. That was only the first one I checked…
kj
nat gas went up almost 40% from oct 2013 to mar 2014…wti went up almost 20% from jan lows to jun highs…
connie hawkins
its no conspiracy theory at all. i’m just saying the calculation is not transparent. no one outside the BLS knows the exact cpi calculation. at the same time its obvious the government benefits greatly from a lower cpi number. if the same cpi calculation were used as was during the volker era, inflation would be @10%, in this thriving, robust economy. and shouldn’t inflation increases be compared to wage increases? 40% of workers in 2012 were actually making less(inflation adjusted) than the minimum wage in 1964.
https://www.outsidethebeltway.com/wp-content/uploads/2011/06/Web2c0602.jpg.cms_-570×350.jpg
Jim
Awesome Howard Marks letter. Thanks for sharing.
Speaking of risk (j/k), is the ECB rate decision on Sept. 4 the tacit admission that Europe would otherwise see a deflationary acceleration? IMO, yes. This isn’t such hot news for the Average Jusef, unless he’s got some euros to throw into the juiced-up market across the pond. That’s how it shook out here, it seems, though there is a gradual improvement. We’re just not used to things taking this long, but maybe the Europeans have more patience.
andrewp111
And the S&P 500 has been just going up and up. I’m not sure how that chart is calculated.