
By Econ Grapher:
This week we look at rising Chinese inflation expectations, signs of improvement in the US non-manufacturing sector, revisions to EU 4th quarter GDP growth, Australian jobs growth, and finish with a review of some of the monetary policy decisions announced this week. The overall theme is pretty much one of growth, inflation, and monetary policy; one that will become increasingly interesting this year.
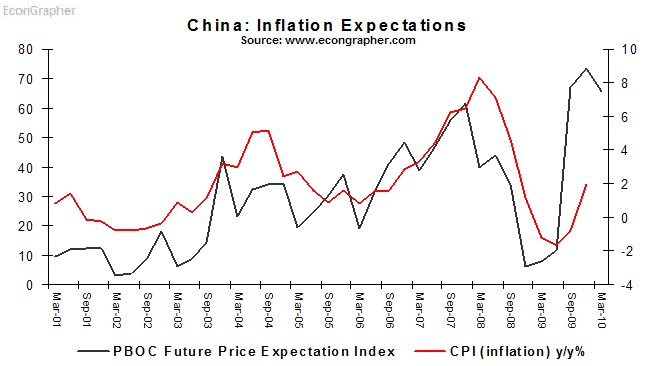
1. China inflation expectations
The data in this chart isn’t new, but it’s probably unknown to most people. The March quarter price expectations index came out in mid-March at 65.6, down from 73.4 (compared to the low in December 2008 of 6.1). This is a startling graph from an inflation point of view, as in the past the future price expectation index has reliably tracked very closely to CPI inflation, and has been a strong leading indicator. So what can you take from this chart? Basically inflation in China is set to rise, and the fundamentals support the idea too; large stimulus spending, rapid loan growth, rapid money supply growth, and commodity price recovery. You could easily argue with this kind of chart that China hasn’t done enough on the monetary policy tightening front yet.
2. US Non-manufacturing PMI
The US Non-manufacturing PMI came out on Tuesday, showing further improvement to 55.4 vs 53 in February, and beating consensus forecasts for a climb to 54. In the components you can also see some promising signs too, for example the new orders index jumped from 55 to 62.3, indicating stronger activity to come. Another bright spot was new export orders spiking up to 57.5 from 47 in February. Another interesting facet was the employment index continuing to rise.

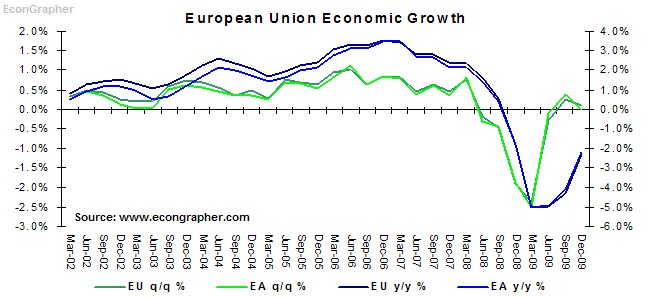
3. EU GDP revision
The European Union statistics agency, Eurostat, released revised GDP figures for the Euro Area. There was broadly speaking, little change to the figures, but it is notable that for the EA16 quarterly growth dropped from 0.1% to zero (and -2.2% vs -2.1%), showing that the Euro Area economies are still struggling, and growing slower than expected. For now the EU is basically headed sideways with subdued growth; as previously mentioned the recovery there is fragile and uneven (e.g. Poland with 2.8% y/y growth vs Latvia with -17.1%).
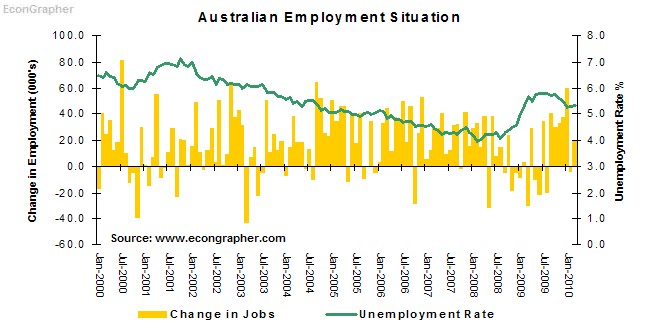
4. Australian jobs growth
The surging Australian economy generated a further 19.6k jobs in March (-4.7k in February), with the split being 30.1k full time and -10.6k part time (indicating possible switching of part to full time). The most interesting aspect of the March Aussie jobs figures was that it now appears as though most of the job growth is driven by full-time job growth. Meanwhile the unemployment rate has virtually gone sideways at 5.3%. As noted by the RBA this week, Australia is seeing growth and inflation tracking near average trend.
5. Monetary policy overview
As an overview of some of the monetary policy decisions last week: The Reserve Bank of Australia increased its cash rate from 4% to 4.25%; The Bank of Japan held at 0.10%, The Bank of England held at 0.50%, The European Central Bank held at 1.00%, and The Bank of Korea held at 2.00%. Also on Monday the US Federal Reserve Governors met but did not change the discount rate as some had surmised, keeping it at 0.75%. For a more in depth look at the Australian, Japanese, and UK/EU decisions check out my reviews published during the week.

Summary
If there is a theme to this week it’s that the recovery is underway, and in some places signs of growth are more obvious. At the same time, with the recovery in economic growth, there is also a recovery in inflationary pressure – again more obvious in some places than others.
One of the key takeaways from this article is the path of Chinese inflation expectations, you can see a strong leading indicator of prices spiking up, and when you think about the fundamentals supporting it, then it’s clear where things are headed. China is due to release much of its main statistics for the March quarter next week.
Another point to note is the EU figures, showing that the recovery there is fragile and uneven but that it is also potentially going to be a bit stop-start in nature. Meanwhile the strong non-manufacturing PMI figures in the US give potential clues to a recovery that may well end up being stronger than some expected. While Australian job growth shows a still strong economy, but interesting dynamics.
On monetary policy, the theme of recovering growth and inflation points to one thing: exit strategies. Already Australia has been leading the charge with interest rate increases, and the EU announced further moves to eventually unwind some of its extraordinary monetary policy measures. Overall though one thing is sure, and that is that the growth-inflation-monetary policy picture will become increasingly interesting as the year unfolds.
Sources:
1. PBOC www.pbc.gov.cn & NBS www.stats.gov.cn
2. ISM www.ism.ws
3. Eurostat epp.eurostat.ec.europa.eu
4. ABS www.abs.gov.au
5. Various central bank websites
Mr. Roche is the Founder and Chief Investment Officer of Discipline Funds.Discipline Funds is a low fee financial advisory firm with a focus on helping people be more disciplined with their finances.
He is also the author of Pragmatic Capitalism: What Every Investor Needs to Understand About Money and Finance, Understanding the Modern Monetary System and Understanding Modern Portfolio Construction.