
By Econ Grapher:
This week we look at the consumer credit numbers out of the US, continued expansion in US nonfarm payrolls, surprising growth in NZ employment, Australasian trade numbers, and China’s PMI for April (and notes on its currency and monetary policy).
1. US consumer credit expands
US consumer credit expanded $2bn in March, against expectations for a -$3bn contraction (and February’s -$11.5). The year on year growth rate is starting to turn up now, signaling that the decline in consumer credit may now be over – or at least that a tentative floor has been found. Looking at the breakdown, Non-revolving credit was the source of the growth, while revolving credit declined. This tells you that much of the growth is driven by things like car sales (which included incentives), rather than consumer spending (revolving credit is generally more associated with general consumer spending). So really, the de-leveraging story still stands for now.

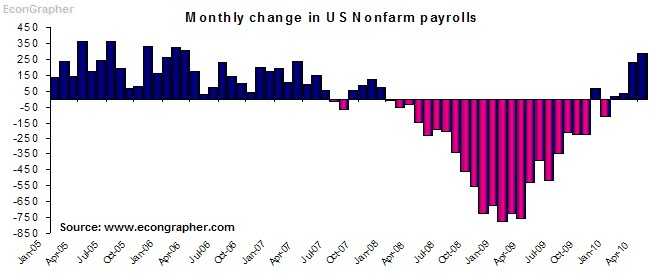
2. US nonfarm payrolls
US nonfarm payrolls surprised to the upside with 290k jobs added in April vs consensus 200k, and an upward revised 230k in March. However the ‘official’ unemployment rate increased to 9.9% from 9.6% due to a surge in the labor force. Census hiring added 66k to the number (48k in March), in a conveniently timed running of the 10-yearly survey. The expansion in payrolls is a welcome respite for the US, following a mass shedding of jobs as the financial crisis hit. The US tends to take it on the chin with jobs; cutting quickly in bad times, but allowing the necessary adjustments to be made.
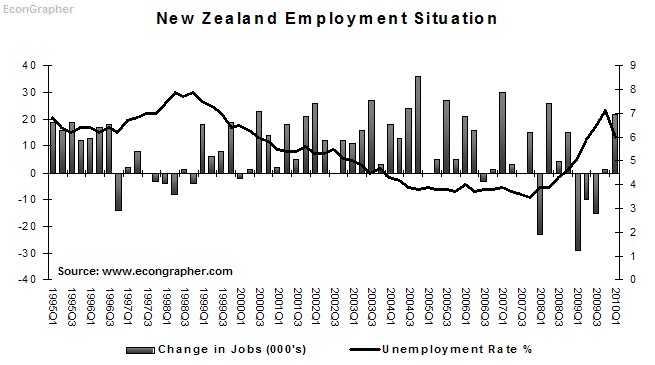
3. NZ Employment surprise
Another surprise this week was the jump in New Zealand employment numbers, the unemployment rate fell to 6% from a downward revised 7%; with 22k jobs added. I ran more indepth analysis of the release here. The main points to take are that much of the jobs were added in the productive sector, and it shows that after 3 quarters of positive GDP growth, the economy is finally starting to pick up. Job ads are on the rise, and confidence is also increasing. The scene is almost definitely set now for the RBNZ to raise the official cash rate by 25bps to 2.75% in June (but then there are external risks e.g. Europe, that could play into the mix).
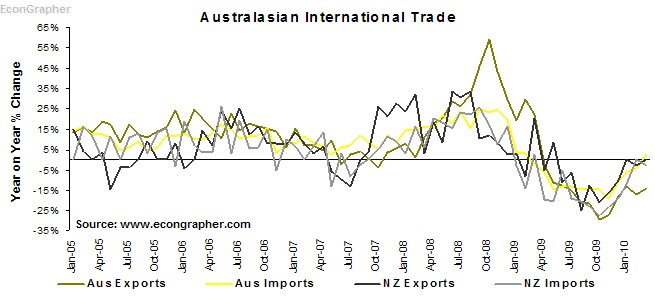
4. Australasian trade
Australia released its international trade figures for March this week, and New Zealand the week before. Australia recorded 2 and 3% growth month on month in exports and imports respectively, with its trade deficit widening to -$2.08bn in March vs -$1.7bn in Feb, and consensus for -$2.13bn. Meanwhile New Zealand reported exports rising higher than imports, recording its 3rd surplus in a row as agricultural commodity prices gave a boost to exports; while demand for imports remained low. It’s pretty clear on the chart and in the numbers that the trend for exports and imports has been turning the corner in both Australia and New Zealand.
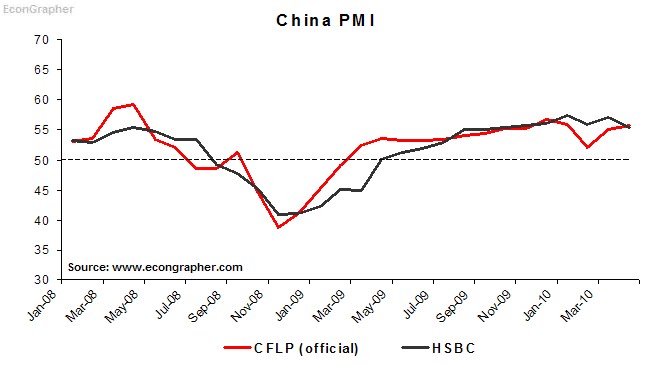
5. China PMI signals further strength
The HSBC PMI was out this week, slipping slightly to 55.4 from 57 in April (and consensus 57); while the official CFLP PMI rose to 55.7 from 55.1 when it was released in the weekend. So both indexes show the outlook for Chinese manufacturing activity is reasonably strong, in spite of a slight hiccup in February; and firmly rebounding since 2008. Of course the obvious implication is that further strength means further chance for overheating, indeed the People’s Bank of China increased the required reserve ratio again last weekend by 50bs, and there has been musings that China will alter its exchange rate policy before the June G-20 meetings.
Summary
Some of the key takeaways from this edition are that the US is still seeing its dubious recovery playing through with some aspects of consumer credit creeping up, and employment beginning to expand through a process of normalisation, stimulus effects, and national surveying. As noted in the analysis of the two US PMI indexes, the US economy is seeing a pick up in activity and signs are for more activity, but the elusive sustainable recovery is yet to be seen.
Looking to Australasia, the growth story continues to play out Australia shows continued strength, and expanding trade (and further interest rate increases – another 25bps this week). Meanwhile New Zealand surprised with its employment numbers, suggesting that the economic recovery there could be picking up; New Zealand also recorded further trade surpluses – but mostly due to cyclical factors. The Australasian economies are islands of growth and stability amongst the developed nations.
Meanwhile – and related to the previous two – China shows no sign of slowing down as the PMIs point to further growth in activity. So the obvious questions of whether or not it’s overheating, and what should be done arise. With the PBOC taking a gradualist approach of tinkering with the reserve requirements ratio, will it be forced to take bigger moves soon? The next few months could be most revealing in that respect.
Mr. Roche is the Founder and Chief Investment Officer of Discipline Funds.Discipline Funds is a low fee financial advisory firm with a focus on helping people be more disciplined with their finances.
He is also the author of Pragmatic Capitalism: What Every Investor Needs to Understand About Money and Finance, Understanding the Modern Monetary System and Understanding Modern Portfolio Construction.
Comments are closed.