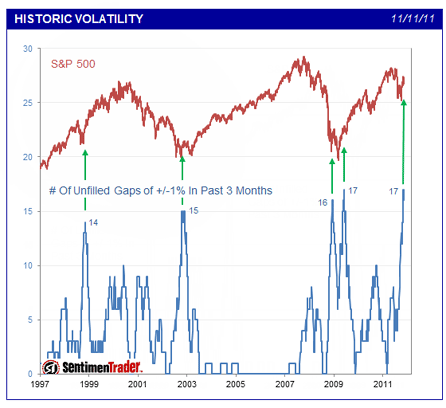
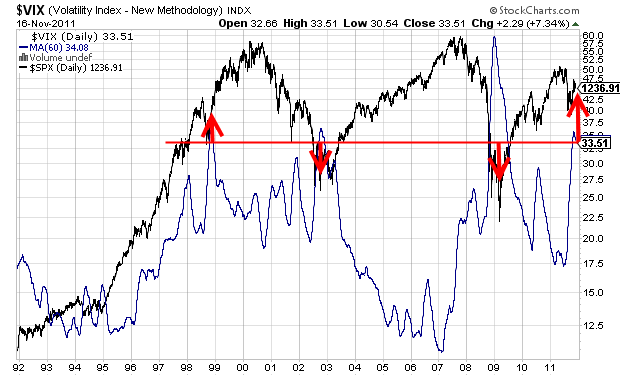
I’ve been posting an abundance of bearish material lately so I thought I’d lighten the mood a bit with something that is pretty bullish. Current levels of volatility are consistent with very bearish longer-term psychological points. Historically, these sorts of readings have been bullish as the market’s participants are poorly positioned for any potential upside surprise. The following two charts provide from insights. The first is via Charles Schwab and Sentiment Trader:
“The final technical chart brings in volatility. On Friday, the market experienced the 17th time in the past three months that the S&P 500 SPY (exchange-traded fund trading the S&P 500) gapped by more than +/- 1% at the open and then didn’t close that gap during the day. This means that the S&P didn’t reverse enough to “kiss” the previous day’s close. As you can see in the chart below, this level of “unclosed gap” behavior has been seen only four other times since the early-1990s. All occurred while the market was forming a major bottom.”
 The second chart shows the 2 month moving average for the VIX. Current readings (pardon the 24 hour old chart) are consistent with buying points on a 24 month basis. Granted, there are only three data points in the last 20 years, but the readings are consistent with high pessimism which tends to be consistent with being closer to a market bottom than top. Additionally, this is only one of many indicators that the modern day investor should track. Nonetheless, it’s worth keeping in your tool belt. Now, I can’t say that I am eating the cooking here because I still abide by my balance sheet recession trading approach, but it’s food for thought for the longer-term investor….As Warren Buffett says – be greedy when others are fearful. There’s little doubt that others are fearful…..

Source: Schwab
Mr. Roche is the Founder and Chief Investment Officer of Discipline Funds.Discipline Funds is a low fee financial advisory firm with a focus on helping people be more disciplined with their finances.
He is also the author of Pragmatic Capitalism: What Every Investor Needs to Understand About Money and Finance, Understanding the Modern Monetary System and Understanding Modern Portfolio Construction.

Comments are closed.