
I’ve spent years here griping about how most people don’t benchmark properly and how we should stop comparing everything to the S&P 500. The logic behind this thinking is simple – at the aggregate level there is only ONE portfolio of all outstanding financial assets. Therefore, “the market” has to be comprised of all these financial assets. When someone talks about the S&P 500 as “the market” they are really just referring to a selection of 500 American corporations that don’t represent all US stocks, global stocks or even close to all of the world’s financial assets. So it makes no logical sense to focus on such a narrow slice of the financial assets that actually impact all of our lives.
If I had it my way the nightly news wouldn’t even mention the stock market or bond market. Financial TV wouldn’t show the stock indices at the top of every headline. Instead, we’d focus on this one aggregate index as the ultimate index. That would give us all a much better idea of how our actual financial assets are changing on any given day, month or year. But for some reason no one actually thinks of things in these aggregate terms. Anyhow…
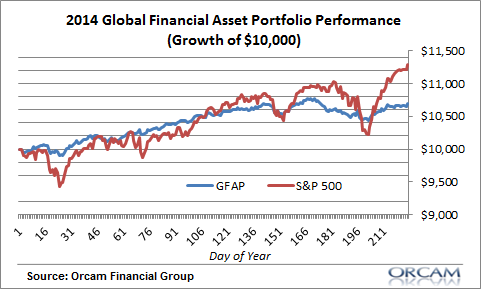
If this global financial asset portfolio is the most important index in the world then how is it doing? Well, I’ve put together a pretty close replication that represents most of the world’s outstanding financial assets. Keep in mind this is an aggregate that includes stocks, bonds, REITs, cash and other assets. I have excluded non-financial assets of all types. So this is still an approximation, but a much better perspective of an “index” than something like the stock index. Here are the performance figures this year:
Global Financial Asset Portfolio
YTD: 6.89%
Annualized return: 7.88%
Std dev: 5.41
Sharpe Ratio: 1.78
We can compare that to the S&P 500 just for some further perspective:
S&P 500
Year to date performance: 12.85%
Annualized Return: 14.73%
Standard deviation: 12.02
Sharpe Ratio: 1.53
Just a bit of global perspective for you.
* Yes, I know that quantifiable risk as standard deviation has limitations as does the use of Sharpe ratio, but these concepts at least provide us with some easily quantifiable metric by which we can analyze portfolios.
Mr. Roche is the Founder and Chief Investment Officer of Discipline Funds.Discipline Funds is a low fee financial advisory firm with a focus on helping people be more disciplined with their finances.
He is also the author of Pragmatic Capitalism: What Every Investor Needs to Understand About Money and Finance, Understanding the Modern Monetary System and Understanding Modern Portfolio Construction.