Back in February I posted a story about the CitiGroup Economic Surprise Index. The market was nearing its short-term highs at the time and I said that the optimism displayed in the index was a sign that the market was fully pricing in the positive news at the time. We sold off 7.5% over the next few weeks as investors began to panic over downside surprises following the Japanese earthquake.
This is how the markets work – in ebbs and flows. Like much of life, economics and markets are cyclical. Remember, the markets are a reflection of our economic reality compared to perceptions. They are not merely a reflection of our economic reality. That’s where indices like my Expectations Ratio and the CESI come in handy. They not only measure our economic reality, but compare that reality to perceptions. In doing so we can gauge the current sentiment compared to reality and help us to navigate the investment mine field.
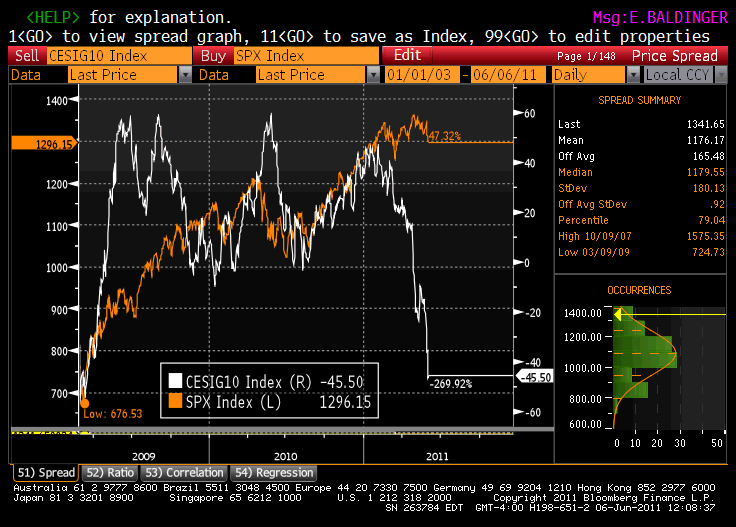
Today, the CESI has moved to the opposite extreme from where it was in February. The analysts are becoming increasingly pessimistic. The following chart from Tim Backshall shows just how extreme this move has been in recent weeks:

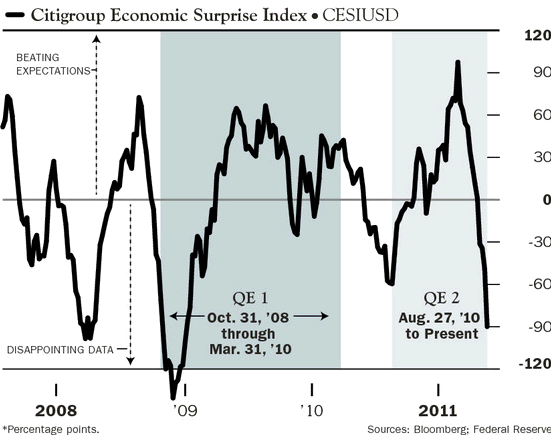
Barrons ran a slightly different version of the same chart over the weekend:

Again, it’s obvious that perceptions tend to reach extremes at major market pivot points. In the last 5 years the CESI has breached the -50 level just four different times. The following data shows the CESI pivot points:
At a current reading of -113 we are well below the average lows for this index and just 28 points shy of its all-time low set during one of the most traumatic investment environments ever. I think it’s safe to argue that we’re closer to a pivot point than most might believe. And that means the analysts are excessively pessimistic in the near-term. If my data mining holds true then the market could find its legs in the near-term. Gauging from 3 month performance, however, is obviously less reliable.
Mr. Roche is the Founder and Chief Investment Officer of Discipline Funds.Discipline Funds is a low fee financial advisory firm with a focus on helping people be more disciplined with their finances.
He is also the author of Pragmatic Capitalism: What Every Investor Needs to Understand About Money and Finance, Understanding the Modern Monetary System and Understanding Modern Portfolio Construction.


Comments are closed.