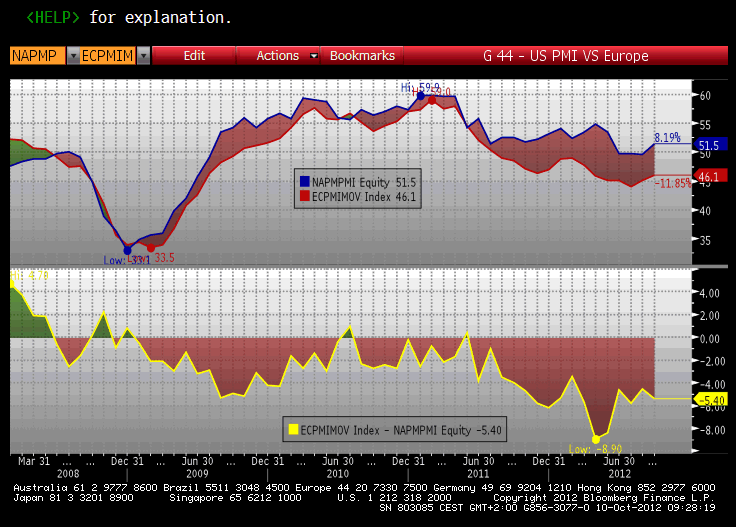
Here’s a good chart (figure 1) via Martin at Macronomics that expands on the divergence between the US and European economies. Although the US economy is not exactly growing strongly, it is growing and Europe continues to contract. In some European countries the economy is not just contracting, but in a full-blown depression. Now, I know the contraction argument isn’t exactly a strong one based on this evidence. A PMI of 51 in the USA isn’t exactly a strong case of a strong divergence. But let’s back up a second.
(Figure 1 – Europe vs USA PMI)
As I’ve shown in the past, big budget deficits during a balance sheet recession haven’t only bolstered economic growth relative to austerity. Where it’s really helped is corporate profits. As we know from Michael Kalecki’s work (see here), when domestic investment is as weak as it is now, government deficits can play a much larger role than usual in steering corporate profits. This makes sense from the view of understanding Monetary Realism since the economy is largely a system of flows. When the domestic private sector stops spending (ie, their flow stops) as it has to a large degree in recent years (due to de-leveraging) then it can be extremely beneficial for the government to step in and turn on the flow. It’s not a coincidence that huge budget deficits are being run while corporate profits hit all-time highs.
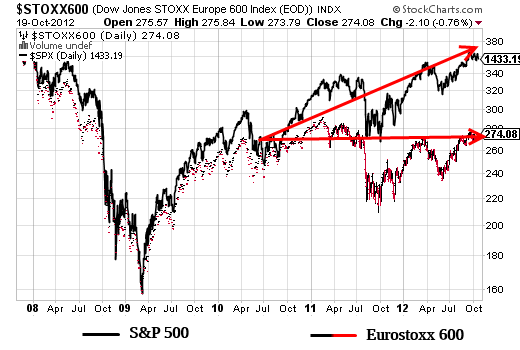
Stock markets don’t perfectly reflect underlying profit streams, but profits are certainly the key component to equity price sustainability. So it’s not surprising that the following has occurred. This chart shows the Eurostoxx 600 versus the S&P 500. As you can see, there’s been a notable divergence in recent years. Ie, the difference in austerity and running big budget deficits during the balance sheet recession hasn’t just meant growth vs contraction at the economic level. It’s also meant the difference between a market that’s flat lined for three years and a market has that has surged.
Mr. Roche is the Founder and Chief Investment Officer of Discipline Funds.Discipline Funds is a low fee financial advisory firm with a focus on helping people be more disciplined with their finances.
He is also the author of Pragmatic Capitalism: What Every Investor Needs to Understand About Money and Finance, Understanding the Modern Monetary System and Understanding Modern Portfolio Construction.


Comments are closed.