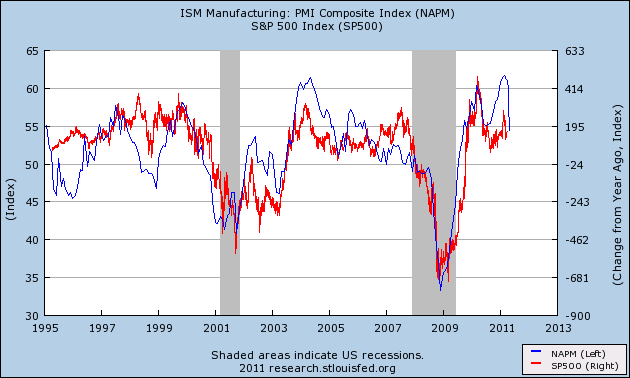
After last month’s ISM Services report I raised the prospect of a lower ISM Manufacturing report and the likelihood that this could all put downside pressure on equities. I was working off of the following chart (commentary from last month is also attached):
“What does it all mean? Well, the good news is that the index is still expanding. Although 52.8 is a big miss it is still an expansion. So it’s not yet time to panic. It is worth noting, however, that lower ISM reports have correlated very highly with equity returns (see here for more). Although the ISM Manufacturing report remains robust at 60.4 it would be surprising to see the two indexes diverge permanently. Because these are diffusion indexes we can likely expect the ISM Manufacturing report to decline in the coming months. And as I discussed last month, that could be a significant headwind for equities – even though it doesn’t point to economic doom.
For now, I still believe the US economy is strong enough to maintain meager growth. The risks still are exogenous – primarily foreign related as China eases their economy and Europe remains mired in a debt crisis. Our balance sheet recession is very much alive, however, the government has done just enough to offset the negative impacts. Unfortunately, the Fed appears to have added another risk to the scenario in commodity prices. We should all hope that the price boom in commodities does not lead to a price collapse. If anything, all of this only confirms the thinking that “hedge in May” is a good idea.”
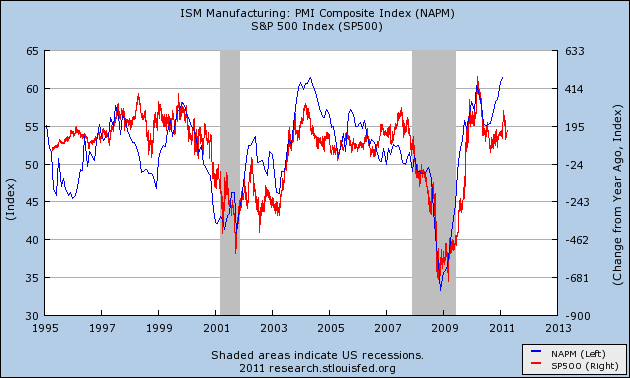
Given the sizable collapse in the ISM Manufacturing earlier this week I think it’s useful to update the chart. The results are astonishing:

We retraced the entire divergence in one month! Despite the convergence, the lesson from May still exists – lower ISM readings tend to correlate with lower year over year returns in the S&P 500.
Mr. Roche is the Founder and Chief Investment Officer of Discipline Funds.Discipline Funds is a low fee financial advisory firm with a focus on helping people be more disciplined with their finances.
He is also the author of Pragmatic Capitalism: What Every Investor Needs to Understand About Money and Finance, Understanding the Modern Monetary System and Understanding Modern Portfolio Construction.


Comments are closed.