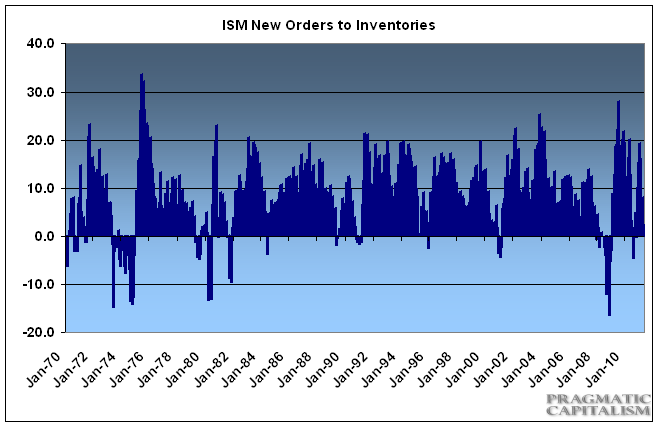
With the ISM hitting the 60+ level in recent months we were bound to see some mean reversion eventually. I didn’t think it would come all in one month (as we saw in last month’s data), but that’s what happened. That’s how these diffusion indices work. They move in a somewhat predictable cyclical pattern.
In an interesting tidbit in this morning’s note with David Rosenberg he cited the momentum effect in the ISM data noting that large moves to the downside tend to overshoot to the downside:
“ISM BELOW 50?
I went back to have a look at the 20 ISM peaks since 1950. When we see a move down to as low as 53.5 from the highs as we just did, it ends up going below the 50 threshold 90% of the time. The average lag time is four months; the median is three months; the mode is two months and the range is one to eight months. The falloff in the ISM order/inventory ratio, which is a pretty good leading indicator, is foreshadowing a sub-50 print in the next few months as well. It is true that we had a “scare” last year as well, but the low was 55.1, not 53.5, and there were fewer headwinds back then too.”
90% probability are odds you generally don’t want to bet against. But the new orders/inventory data is not as conclusive as Mr. Rosenberg might presume. The latest reading of 2.3 is well off the recent highs, but this reading has tended to move into multi month negative territory preceding US recessions.

The trend is clearly not in the right direction, but I think it’s a bit too early to conclude that the ISM data is leading to some sort of collapse in growth. The balance sheet recession is very much alive so while we still have to worry about low growth and exogenous risks I think it’s a bit extreme to conclude that the US economy is going to see a dramatic decline in growth in the coming months.
Mr. Roche is the Founder and Chief Investment Officer of Discipline Funds.Discipline Funds is a low fee financial advisory firm with a focus on helping people be more disciplined with their finances.
He is also the author of Pragmatic Capitalism: What Every Investor Needs to Understand About Money and Finance, Understanding the Modern Monetary System and Understanding Modern Portfolio Construction.

Comments are closed.