
Lots of informative data today so let’s take a quick look at the big picture here.
Today’s Philly Fed Survey came in hot at 19.8. That’s on the back of a moderately positive industrial production report and the strong NY Fed report. This brings the composite real-time index up to 16.9 which is its best reading since February 2012 (see figure 1). The 3 month moving average is at 11.8 which is the highest reading since May of 2012. Manufacturing in the US might just be picking up a bit of momentum.
The jobless claims data also showed a continued positive trend. As I’ve mentioned many times in the past, this continues to be one of the best real-time indicators of the economy’s overall trend. The latest reading of 346,000 is actually pretty flat relative to recent readings, but the good news is that the data doesn’t appear to be deteriorating. Jobless claims always spike before a recession so this continues to point to an okay environment.
Overall, there’s not much different here from what we’ve been seeing for years. Growth is extremely modest and corporations are able to maintain margins with meager revenue growth and careful cost management. It looks like the equity market is in a Fed obsessed multiple expansion phase which might not make a lot of sense to most, but until the equity market has a reason to instill some sustained fear in people then the path of least resistance continues to be up.
Charts via Orcam Investment Research:
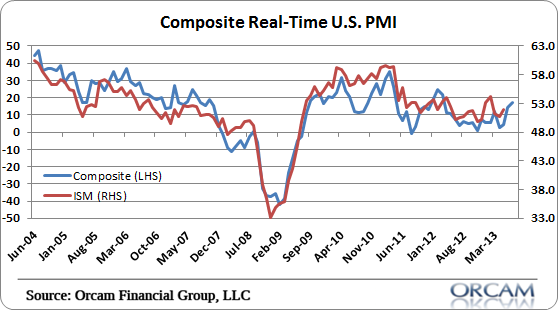
(Figure 1 – Composite Real-Time PMI)
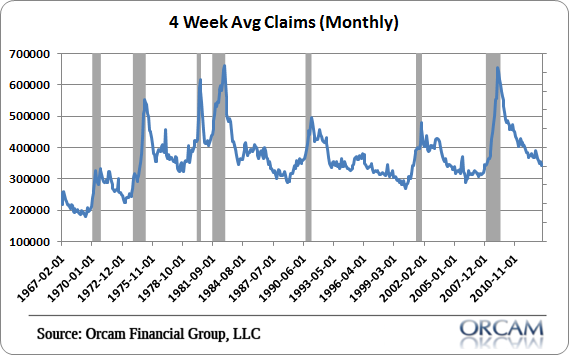
(Figure 2 – 4 Week Avg Claims)
Mr. Roche is the Founder and Chief Investment Officer of Discipline Funds.Discipline Funds is a low fee financial advisory firm with a focus on helping people be more disciplined with their finances.
He is also the author of Pragmatic Capitalism: What Every Investor Needs to Understand About Money and Finance, Understanding the Modern Monetary System and Understanding Modern Portfolio Construction.
Comments are closed.