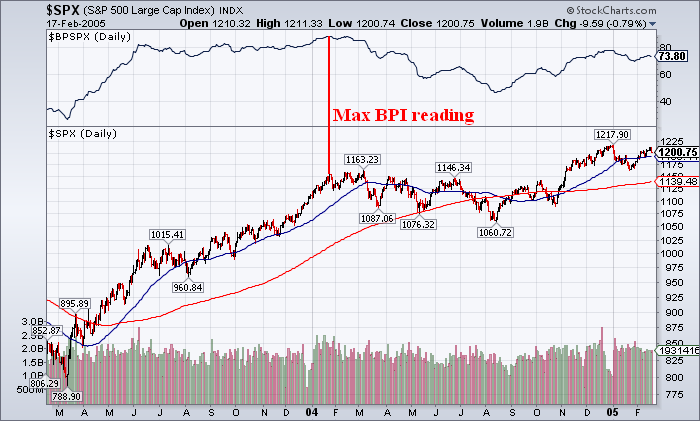
From a sentiment level we’ve been maxed out on bullishness for a while now. Based on analyst’s expectations you can also make a convincing case that broad economic strength is widely expected and largely priced in. And finally, from a technical perspective it looks like we’re finally approaching max bullishness. One indicator I like to keep an eye on is the Bullish Percentage Index. It tracks the breadth of the market and gives a broad overview of whether a market is oversold or overbought. What’s remarkable about the current reading on the S&P BPI is that it has only occurred ONCE in the last 15 years. On January 26th, 2004 the S&P Bullish Percentage Index peaked at 88.8%.

Reviewing this data shows some remarkable similarities. The market was in the early portion of a substantial bull market. After an August low the market had rallied 20%+ into the early portion of 2004. The market moved from an extreme bearish level to an extreme bullish level in this 6 month rally. What happened next? In the near-term this proved to be a headwind for the market as the S&P peaked almost to that exact day and ultimately traded 7% lower within the next 3 months. Within 6 months it traded 9% lower. It did not spell doom in the longer-term, however. After digesting this max bullishness the market traded in a range and then resumed its uptrend. 12 months following this unusual reading the market was 4% higher.
Obviously, this lone indicator is meaningless when looked at by itself, however, given the unusual reading and the other confirming signs of extreme bullishness this is worth taking into consideration. On the other hand, this could prove to be another indicator that needs to be thrown out the window as the market powers higher knowing that good news is bullish and bad news means more Bernanke Put.
Mr. Roche is the Founder and Chief Investment Officer of Discipline Funds.Discipline Funds is a low fee financial advisory firm with a focus on helping people be more disciplined with their finances.
He is also the author of Pragmatic Capitalism: What Every Investor Needs to Understand About Money and Finance, Understanding the Modern Monetary System and Understanding Modern Portfolio Construction.

Comments are closed.